BP vs Shell: key findings
- BP has more cost-efficient upstream operations than Shell
- BP’s operations are more environmentally-friendly when compared to Shell
- BP’s profitability is more sensitive to oil price crashes
- BP’s upstream faces threats from Shell’s aggressive capital expenditure plans over the next five years
- Shell has a clear competitive advantage in the near future
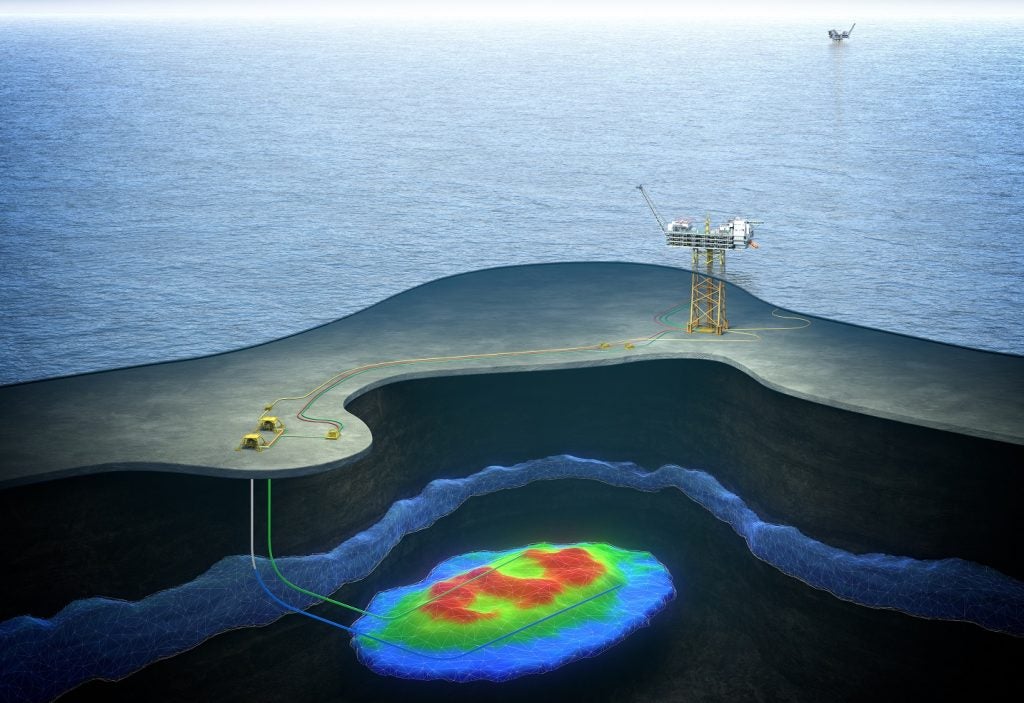
Business scale
Shell has consistently earned higher revenues than BP due to the larger scale of its operations. In the last ten years, Shell’s revenues were 22.2% higher compared to BP’s, on an average. The revenue gap has nearly doubled in the last four years, from 16% to 23%.
Oil & gas account for the majority of the revenues for both the companies.
Go deeper with GlobalData

BP or Shell – who is better placed to absorb an oil price crash?
Price volatility is a significant risk to profits in the oil and gas business.
Higher focus on upstream and lower offset from downstream makes BP’s profitability more sensitive to oil price changes, unlike Shell.
As history shows, when the oil prices crashed 70% between 2014 and 2016 in one of the worst crashes in 30 years, Shell’s profits were not only less affected but also recovered quicker than BP.
The oil price slump in 2014-2015 caused nearly the same effect on revenues at both the companies, but the profit decline was much higher for BP at 261%, compared to Shell, which saw just an 85% decline.
How well do you really know your competitors?
Access the most comprehensive Company Profiles on the market, powered by GlobalData. Save hours of research. Gain competitive edge.

Thank you!
Your download email will arrive shortly
Not ready to buy yet? Download a free sample
We are confident about the unique quality of our Company Profiles. However, we want you to make the most beneficial decision for your business, so we offer a free sample that you can download by submitting the below form
By GlobalDataDuring all the three years of rapid oil price fall in 2014, 2015, and 2016, BP’s net profit fell at a much higher rate compared to Shell exposing its extreme sensitivity to oil price crashes.
!function(){“use strict”;window.addEventListener(“message”,function(a){if(void 0!==a.data[“datawrapper-height”])for(var e in a.data[“datawrapper-height”]){var t=document.getElementById(“datawrapper-chart-“+e)||document.querySelector(“iframe[src*='”+e+”‘]”);t&&(t.style.height=a.data[“datawrapper-height”][e]+”px”)}})}();
During the recovery, BP returned to profits recording a 101% growth in profits in 2016 with a 17.89% revenue decline while Shell’s revenues declined at a lower rate of 11.84% and profit grew at a higher 117%.
“BP’s profitability is more sensitive to oil price crashes than Shell’s.”
BP or Shell – who has more oil and gas assets?
BP has more proved reserves compared with Shell and has also been consistent in maintaining it’s reserves volume over the last ten years.
The average proven oil and gas reserves of BP over the last ten years are approximately 20% higher compared to Shell. BP’s proven reserves in 2018 were 72% higher than those of Shell, at 19,945Mboe.
Furthermore, BP boasted of a 100% reserves replacement ratio (RRR) in 2018, supported by project investments and revision of existing projects. The company has maintained an average RRR of more than 100% over the last three years.
Shell had a RRR of 53% in 2018, attributed to divestment and the plan to reduce production from the Groningen field in the Netherlands. Over the last three years, the company has, however, maintained an average RRR of 96%.
Comparison of oil and gas operations
BP beats Shell in both efficiency and refining availability, but trails behind in production capacity.
BP has more cost-efficient upstream operations, with its ten-year average upstream unit production cost ($9.46bn per barrel of oil equivalent) being roughly 18% less than that of Shell ($11.64 per barrel of oil equivalent).
BP’s refining availability was also higher at 94.87%, compared to Shell’s 91.66% during the period.
BP, however, trails behind Shell in production capacity, although it historically had a higher production capacity than Shell.
BP’s daily average production capacity has steadily declined by 22.39% between 2009 and 2018, to a ten-year average of 3.29Mboe, but Shell has managed to reach 3.49Mboe in capacity over the same period by increasing its capacity by 14.64%.
“BP has more cost-efficient upstream operations than Shell.”
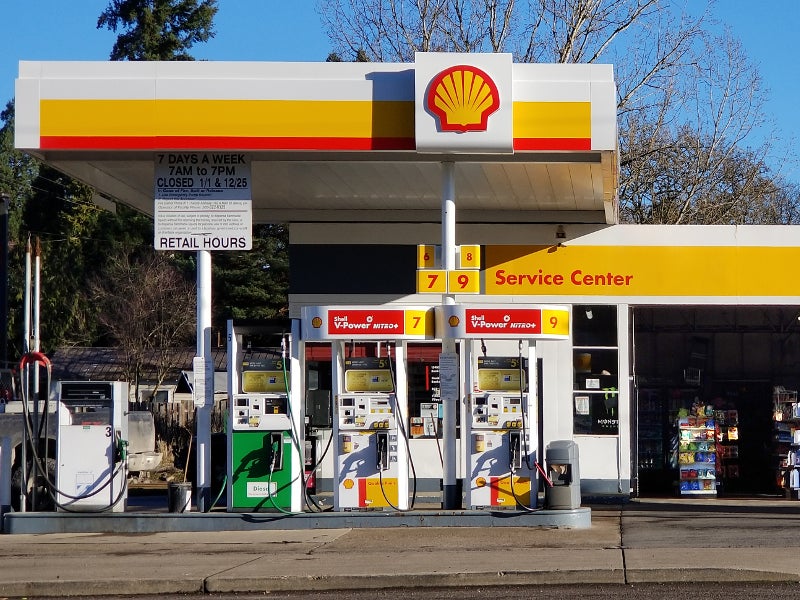
Retail network makes Shell’s downstream stronger than BP’s
A stronger retail network of more than 44,000 stores in 75 countries, mostly company-operated, is a competitive advantage for Shell.
In the last ten years, Shell’s average retail sites across more than 70 countries numbered 43,444, and are outlets for gasoline, diesel, heating oil, aviation fuel, marine fuel, biofuel, lubricants, bitumen, and sulphur.

Comparatively, BP’s network of 18,700 branded retail stations in 78 countries is 60% smaller than that of Shell. BP’s retail sites declined steadily from 2009 to 2015 before increasing from 2016, averaging at 19,420 over the last ten years. The company markets gasoline, diesel, jet fuel, bitumen and lubricants through these retail sites.
The strong network helps Shell to sell its branded products and provides strong operational leverage in integrating electric vehicle (EV) charging services, an area where Shell has moved much quicker than BP, to take advantage of the possible increase in global EV sales in future.
The International Energy Agency (IEA) estimates approximately 280 million EVs to be on road globally by 2040.
BP is taking an inorganic route to bridge the gap as it plans to open convenience partnership sites such as M&S Simply Food® in the UK, MyAuchan® in Luxembourg, and REWE to Go® in Germany as they deliver substantially higher returns than the industry average site.
It opened 220 REWE to Go® convenience retail sites in Germany in 2018, the 440th branded retail site in Mexico and its first site in Indonesia. The company also plans to enter China and India in the future.
“Shell’s strong retail network is incomparable to that of BP, although the latter is trying ti bridge the gap through inorganic means.”
Emissions – BP is more environment-friendly than Shell
BP has improved its focus on emissions and safety following the Deepwater Horizon explosion. The direct greenhouse gas emissions measured in millions tonnes of CO2-equivalent have consistently declined over the last ten years for the company, averaging at 55.67.
Shell’s emissions were 30% higher on average, at 72.6, during the same period.
Safety
BP’s focus on safety has also improved significantly following the Deepwater Horizon explosion that damaged the company’s reputation and exposed its operational safety flaws.
Over the last five years, BP recorded a lower number of tier 1 safety events that averaged at 19.6, compared to 46.2 for Shell. BP also did better with tier 2 safety events, which stood at 75.8 compared to Shell’s 134.6.
BP, however, has failed to reduce the number of oil spills (147.9 on an average over the last ten years), whereas Shell has managed to consistently reduce oils spills down from 275 to 92 during the same period.
Focus on alternative energy business
The revenue share of alternative energy business is currently nominal for both BP and Shell but has scope for a high growth as the world is shifting increasingly in favour of cleaner energy.
Both BP and Shell have businesses in solar, biofuels, renewable products, biopower, wind energy and EVs, but Shell’s alternative energy plans are bigger, as it plans to invest $1bn-$2bn a year by 2020 to strengthen its position in the renewable industry.
BP has not outlined any major plans apart from a $200m investment over three years in solar projects, but it’s acting fast to capitalise on opportunities in EV charging.

BP acquired Chargemaster, the UK’s largest electric vehicle charging network, in 2018 and has also invested in ultra-fast charging battery technology developer StoreDot and mobile rapid EV charging systems developer FreeWire.
Shell, however, may have a competitive advantage in the EV charging space, owing to its wider retail presence through which it can deploy EV charging services quicker and more profitably.
“Emissions from Shell’s operations were 30% higher than BP’s over the last ten years.”
BP vs Shell – what the future holds for the competition
Thanks to a larger operational scale and a vast retail network, Shell clearly has a competitive edge over BP in the near future.
Further, Shell’s aggressive upstream investments are expected to make the competition tougher for BP. Shell’s capex on planned and announced upstream projects from 2019 to 2025 is estimated at $54.6bn, the highest in the world among oil and gas companies (Source: GlobalData), whereas BP trails far behind.
BP will have to continue its focus on increasing reserves and broaden its retail network in order to achieve a similar scale and be ready to capitalise on future opportunities in the downstream business.
Furthermore, as the world braces for cleaner fuels, BP will have to invest in alternative energy at least as aggressively as Shell to cash in on these oppurtunities.