
Hearne is offering a 20% discount for purchases before 20 Dec 2012; when ordering please use code: HEARNE18. The discount applies to products on this page for orders less than $5,000 (phone orders only).
For over 30 years Hearne has been a major distributor and developer of technical software in Australia and New Zealand, distributing software for engineering, mathematics, data analysis, forecasting, graphing, contouring and modelling risk, as well as experience in software commercialisation.
Hearne’s software partners include PTC, IBM, Wolfram Research, Oracle, Intel, OriginLab and the CSIRO. Hearne also provides training and a range of consulting services.
Engineering calculations with Mathcad
Calculations are the heart of engineering information, yet too many companies fail to properly solve, document and share their engineering calculations. They lose invaluable intellectual property with every new project, resignation or retirement.
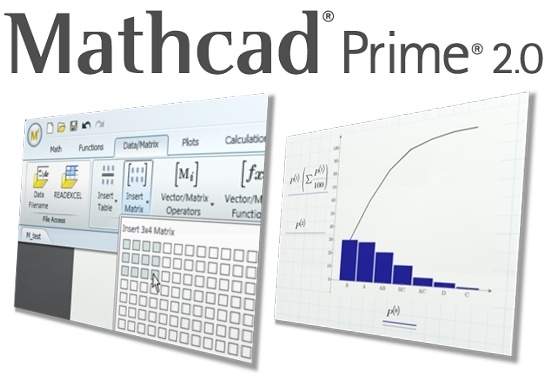

Mathcad is the first and only engineering calculation solution that simultaneously performs and documents engineering calculations, while dramatically reducing the risk of costly errors.
Mathcad enables professionals worldwide to perform, document, manage and share calculation and design work. Mathcad’s easy-to-use whiteboard interface combines live, natural mathematical notation, text and graphs into a single worksheet, making Mathcad ideal for knowledge capture, calculation, sharing and reuse.
Monte Carlo Simulations with Crystal Ball to transform spreadsheets and model risk
Transform your Microsoft Excel spreadsheets to get a credible picture of risk, create accurate predictive models, search for the best solution and maximise appreciation of the risks that you are facing.
From Monte Carlo simulation to forecasting and optimisation, Crystal Ball software tools deliver. Crystal Ball is the industry-standard for oil, gas and mining company executives to analyse the uncertainties in their spreadsheet models.
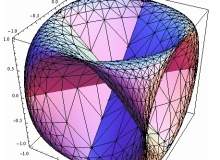
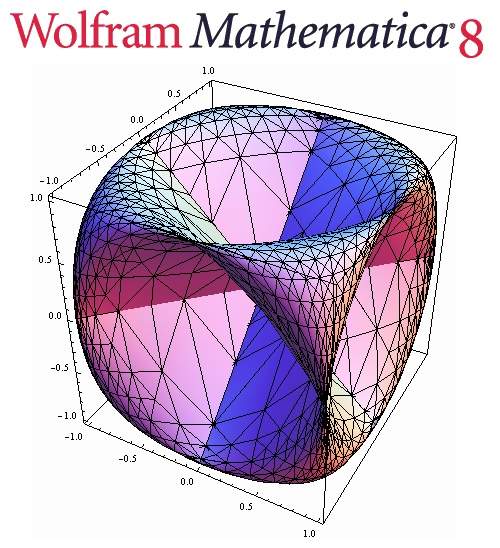
Calculations with Mathematica for calculations, modelling, simulation, visualisation and development
On the surface, Mathematica is a powerful yet easy-to-use calculator. However, Mathematica functions work for any size or precision of numbers, computes with symbols, are easily represented graphically, automatically switch algorithms to get the best answer and even check and adjust the accuracy of their own results.
This sophistication means trustworthy answers every time, even for those inexperienced with the mechanics of a particular calculation. While working through calculations, a notebook document keeps a complete report of inputs, outputs and graphics in interactive typeset form.
With notebook document technology, a fully-customised interface can easily be provided so that recipients can interact with the content. The notebook is a fully-featured, fully-integrated technical document-creation environment. If you are doing anything technical, think Mathematica; not just for computation but for modelling, simulation, visualisation, development, documentation and deployment.
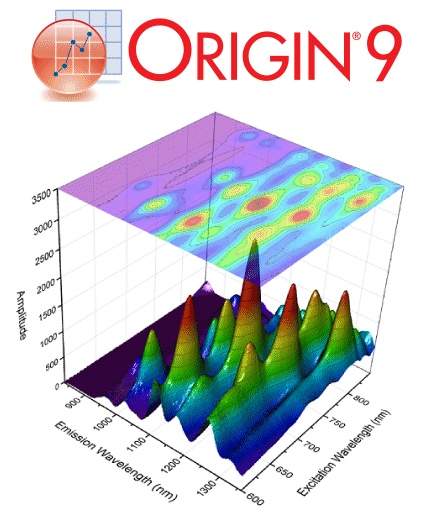
Data analysis and graphing with Origin and Origin Pro
Origin provides a data analysis and graphing workspace for scientists and engineers. Multi-sheet workbooks, publication-quality graphics and standardised analysis tools provide a tightly-integrated workspace for you to import data, create and annotate graphs, explore and analyse data, as well as publish your work.
To ensure that Origin meets your data analysis requirements, intuitive tools for advanced statistics, regression, nonlinear curve fitting, signal processing, image processing and peak analysis are built-in.
Forecasting and modelling with EViews
A combination of power and ease-of-use makes EViews the ideal package for anyone working with time series, cross-section or longitudinal data. With EViews, you can quickly and efficiently manage your data, perform econometric and statistical analysis, generate forecasts or model simulations and produce high-quality graphs and tables for publication or inclusion in other applications.
Featuring an innovative graphical object-oriented user-interface and a sophisticated analysis engine, EViews blends the best of modern software technology with the features you have always wanted. The result is a state-of-the art programme that offers unprecedented power within a flexible, easy-to-use interface. Find out for yourself why EViews is the worldwide leader in Windows-based econometric software and the choice of those who demand the very best.
2D and 3D design and drafting with AutoCAD
The AutoCAD software application for 2D / 3D design and drafting propels day-to-day drafting forward with features that increase speed and accuracy while saving time. AutoCAD software simplifies daily tasks with full DWG native file format compatibility, annotation scaling, layer properties per viewport, text and table enhancements, in addition with multiple leaders.
3D surface mapping with Surfer
Surfer contour maps give you full control over all map parameters. You can accept the Surfer intelligent defaults to automatically create a contour map, or double-click a map to easily customise map features. Display contour maps over any contour range and contour interval, or specify only the contour levels you want to display on the map. And with Surfer you can add colour fill between contours to produce dazzling displays of your maps, or produce gray scale fills for dramatic black and white printouts.