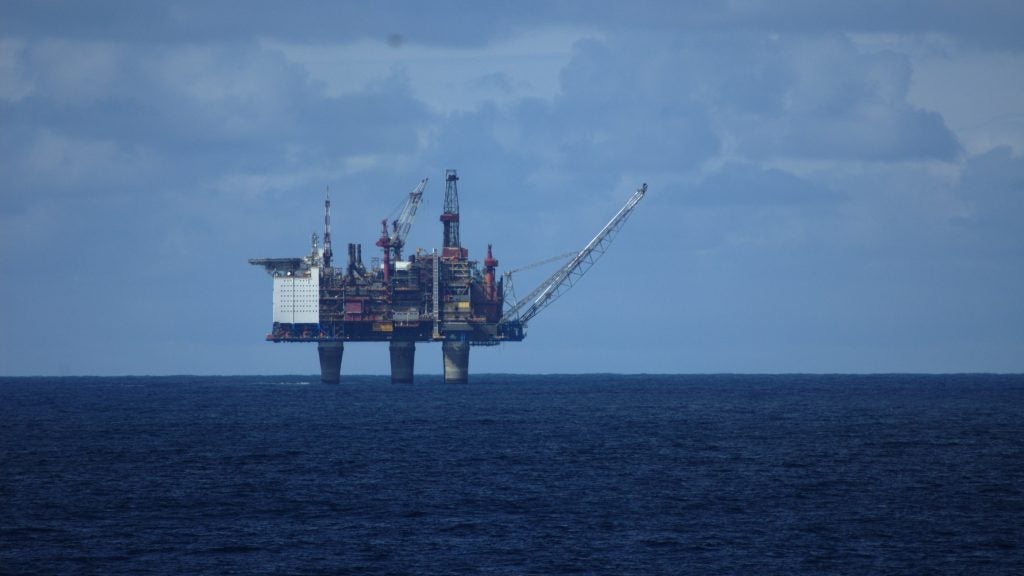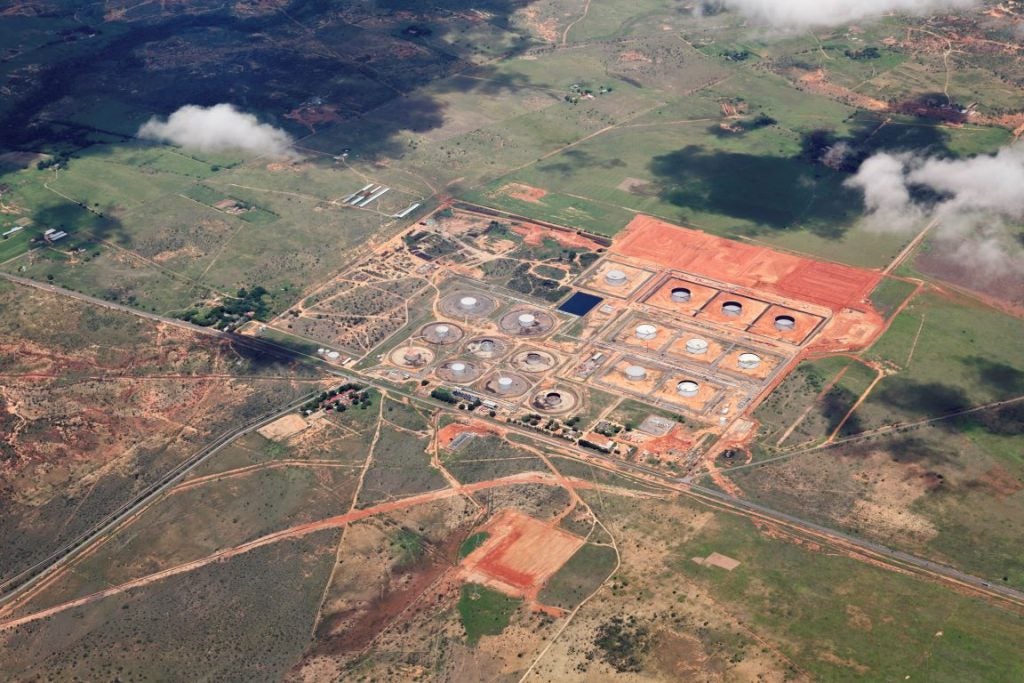
The current financial crisis has put immense pressure on cash flows of companies by lowering commodity prices and making external finance difficult and expensive to access. The diminishing expected rate of return on projects due to volatility in crude oil price, coupled with a lack of funding for projects due to the tightening of credit markets, is the major reason for decline in capital expenditure in 2008 and 2009. Reduction in expenditure has led to lower exploration and production activities. Under such circumstances, most oil and gas companies will prepare their capital budgets more realistically in line with their internal cash flows.
Demand for oil reduced by 2.5% in the last quarter of 2008 and an additional 3.6% in the first quarter of 2009. Weak oil demand followed by plunging oil prices has made investments in oil and gas projects less profitable or attractive. Moreover, the cost of construction and equipment has not dropped to the levels of oil prices, leading to tightening of cash flows of oil and gas companies. Volatility in oil prices and deteriorating market sentiments has held back expansion plans in supply capacities, which has adversely affected capital expenditure in oil and gas projects. This, in turn, has led to extended periods of excess capacity or supply shortages, which has fuelled further volatilities.
Simultaneously, the global credit crunch has forced a scaling down of capital expenditure in the oil and industry worldwide. Banks and other financial institutions have increased their interest rates and have also tightened their lending policies to check diminishing liquidity and maintain a strong balance sheet. Growing concerns about falling asset values and disordered credit markets have led to a negative impact on investment plans of many oil and gas companies.
Most companies operating across the oil and gas value chain are reviewing their capital expenditure plans as many of their planned or proposed projects have been rescheduled, while a significant number of ongoing projects have been deliberately slowed down or suspended. Almost all the major E&P companies are cutting back on capital expenditure plans for 2009, which they had announced earlier, and are realigning their capital budgets awaiting a stable oil and gas market with higher oil prices.
However, investment pattern varies with different types of companies, the degree of capital intensity required in projects and different countries where oil and gas companies operate.
See Also:
The current global economic slowdown has affected integrated and independent oil and gas companies more than national oil companies (NOCs). Many NOCs planned to maintain their capital expenditures for 2009 in line with that of 2008 or increase them above 2008 level, backed by their robust balance sheets and government funding. However, volatility in oil and gas prices and vague estimates of future demand make it difficult for the NOCs to estimate planned investments to secure their future supplies.
How well do you really know your competitors?
Access the most comprehensive Company Profiles on the market, powered by GlobalData. Save hours of research. Gain competitive edge.

Thank you!
Your download email will arrive shortly
Not ready to buy yet? Download a free sample
We are confident about the unique quality of our Company Profiles. However, we want you to make the most beneficial decision for your business, so we offer a free sample that you can download by submitting the below form
By GlobalData| Capital Expenditure Plans of Integrated and Independent Oil & Gas Companies for 2008 and 2009 | |||
| Company | 2008 | 2009 | Change 2009/2008 |
| BG | 7.77 | 5.75 | -26 |
| BP | 22 | 19 | -13.6 |
| Chevron | 22.8 | 19.7 | -13.6 |
| ConocoPhillips | 19.1 | 12.5 | -34.6 |
| ExxonMobil | 26.1 | 29 | 11.1 |
| Lukoil | 11.1 | 5.1 | -54.1 |
| Marathon | 7.4 | 5.5 | -25.7 |
| Occidental | 6.8 | 3.5 | -48.5 |
| Shell | 32 | 31 | -3.1 |
| Total | 18.3 | 18.2 | -0.5 |
| Anadarko | 5.3 | 4.2 | -20.8 |
| Apache | 5.9 | 3.4 | -42.4 |
| Canadian Natural Resources | 6.4 | 2.7 | -57.8 |
| Devon Energy Corp. | 9.4 | 4.5 | -52.1 |
| EnCana | 7.4 | 5.7 | -23 |
| Suncor | 7.6 | 3 | -60.5 |
| Talisman | 5.2 | 3.2 | -38.5 |
| XTO | 3.68 | 3.2 | -13 |
| PetroCanada | 5.06 | 3.23 | -36.2 |
| Source: GlobalData: What’s Driving New Oil & Gas Investments in 2009 | |||
This report is a licensed product and should not to be reproduced without prior permission.
The information in this document has been extracted from Alternative Energy eTrack by a registered user.
GlobalData holds no responsibility for the loss of original context and for any changes made to information following its extraction.
All information was current at the time of extraction, although the original content may have been subsequently updated.


