

The gas market entered 2026 braced for a glut and got a transit shock instead. The de-facto closure of the Strait of Hormuz cut off access to around 20% of global liquefied natural gas (LNG) supply, and the strikes on Ras Laffan on 18–19 March damaged two trains with 12.8 million tonnes per annum (mtpa) of capacity – roughly 17% of Qatar’s export capacity. GlobalData’s first Gas Market Outlook finds that the shock delays the glut rather than calling it off, and that how long the glut lasts depends less on gas in the ground than on the routes available to bring it to market.
A trade map built around two corridors
The shock hit a market that depends on a few long-distance routes. Of the 583 billion cubic metres (bcm) of LNG traded in 2025, Asia-Pacific took 364bcm, or around 62% (Figure 1). The Middle East shipped 113.4bcm of LNG to Asia-Pacific, approximately 85% of its exports, most of it through Hormuz. On the other side of the map, North America shipped 105.5bcm to Europe, around 60% of Europe’s LNG imports. The two corridors carry more than a third of world LNG trade, and the closure of the first left Asian buyers competing with Europe for cargoes from the second.
Go deeper with GlobalData


Access deeper industry intelligence
Experience unmatched clarity with a single platform that combines unique data, AI, and human expertise.
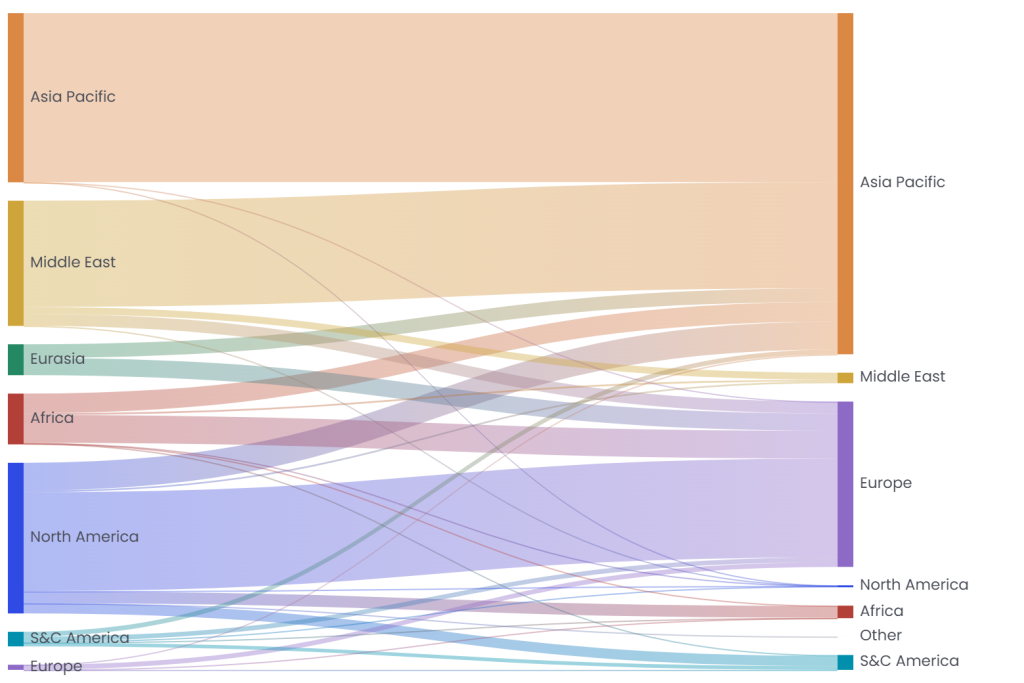
In GlobalData’s reference case, Middle Eastern production falls by 98.7bcm in 2026, so world supply grows by only 14.9bcm against 37.7bcm of notional demand growth, and the apparent balance tightens from 40.6bcm to 17.8bcm. GlobalData estimates the demand that physically could not be served this year at 38–59bcm. The Title Transfer Facility averaged close to $16/Mbtu in the second quarter, up 32% year on year, while the Henry Hub fell, because US export capacity was already running at its ceiling.
Every scenario but one ends the glut by the mid-2030s
From 2027, Gulf exports return and a record construction pipeline starts up: 281.3mtpa of liquefaction at the construction or commissioning stage comes online by 2031, much of it in the US and Qatar. In the reference case, the apparent surplus peaks at 199bcm in 2029 (Figure 2). It then closes quickly, because demand keeps rising, by 19.8% to 5.18 trillion cubic metres (tcm) in 2035, and does not peak before 2035 in any of GlobalData’s six scenarios. Once the dated construction pipeline runs out after 2030, the market is balanced in 2034 and short by 63bcm in 2035.
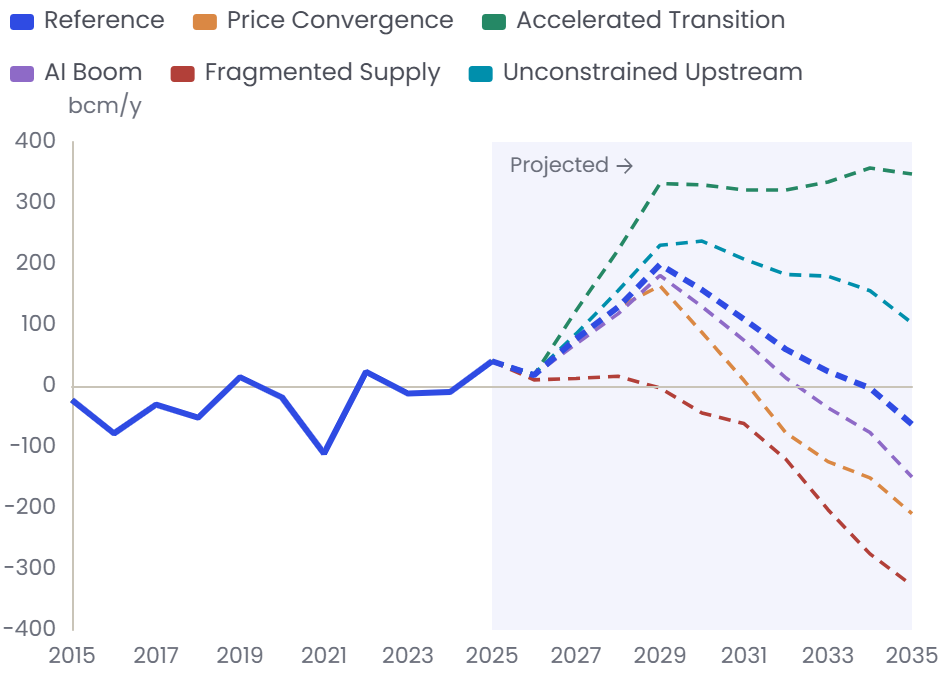
The scenarios move the timing more than the direction. In Price Convergence, cheaper LNG draws in demand and the surplus is gone by 2032. In Fragmented Supply, delayed and cancelled projects leave the market short from 2029, and by 327bcm in 2035. AI Boom adds 86bcm of demand by 2035 and turns the balance negative from 2033. Only Accelerated Transition, which removes 410bcm of 2035 demand, keeps the market long throughout.
The constraint is infrastructure, not geology
The 2035 deficit does not reflect a shortage of gas. Run field by field, GlobalData’s asset-level model shows the world could produce 5.29tcm in 2035, enough to keep the market 103bcm long in the Unconstrained Upstream case. The difference is 166bcm of planned production, in 13 countries, that has no sanctioned or final investment decision (FID)-dated route to market. Most of it sits in new offshore provinces in Senegal, Tanzania, Mauritania, Guyana and Cyprus. The US faces the opposite problem: its approved and FID-dated liquefaction needs around 400bcm more gas in 2035 than US companies have yet committed to produce.
Conclusion
The LNG wave will make the market long from 2027, but for a shorter period than many expect, and the 2027–2033 surplus is more likely to be worked off by a mix of cheaper LNG drawing in demand and supply that slips or is lost than to persist. The 2026 shock showed how much of the market rests on two corridors. For the 2030s, whether export routes are sanctioned in the new provinces, and whether US production keeps pace with US liquefaction, will decide if the market tips into deficit. GlobalData’s Gas Market Outlook 2026 sets out that balance year by year, country by country, and across six scenarios: GlobalData Gas Market Outlook 2026.


